TL;DR: Data visualization turns raw Amazon data into clear, actionable dashboards. This guide walks you through building a dashboard for your Amazon business—covering key metrics, tools, and a step-by-step process to start today.
Key Takeaways
- An Amazon business dashboard centralizes sales, profit, advertising, and inventory metrics into one visual view, helping you spot trends and make faster decisions.
- Focus on 5–10 KPIs that align with your goals—like revenue, ACOS, sell-through rate, and conversion—instead of tracking every possible number.
- Tools such as SellerSprite, Google Data Studio, and Tableau integrate with Amazon to automate data collection and create professional dashboards.
- Building a dashboard is a six-step process: define goals, connect data, choose visuals, design layout, automate updates, and refine over time.
- Advanced dashboards support decision-making with forecasting, alerts, and even AI-driven insights, helping you stay ahead of market changes.
Table of Contents
Note on marketplaces: This guide is specifically optimized for the US market.
Running an Amazon business means drowning in data: sales reports, ad performance, inventory levels, customer reviews, and more. Without a clear way to see the patterns, you're making decisions on gut feel. Data visualization—turning raw numbers into charts, graphs, and dashboards—lets you spot trends fast, communicate insights to your team, and act before your competitors. In this guide, you'll learn exactly how to create dashboards for your Amazon business, even if you're not a data expert. We'll cover the metrics that matter, the tools that make it simple, and a step-by-step playbook to build a dashboard that drives growth.
What Is an Amazon Business Dashboard?
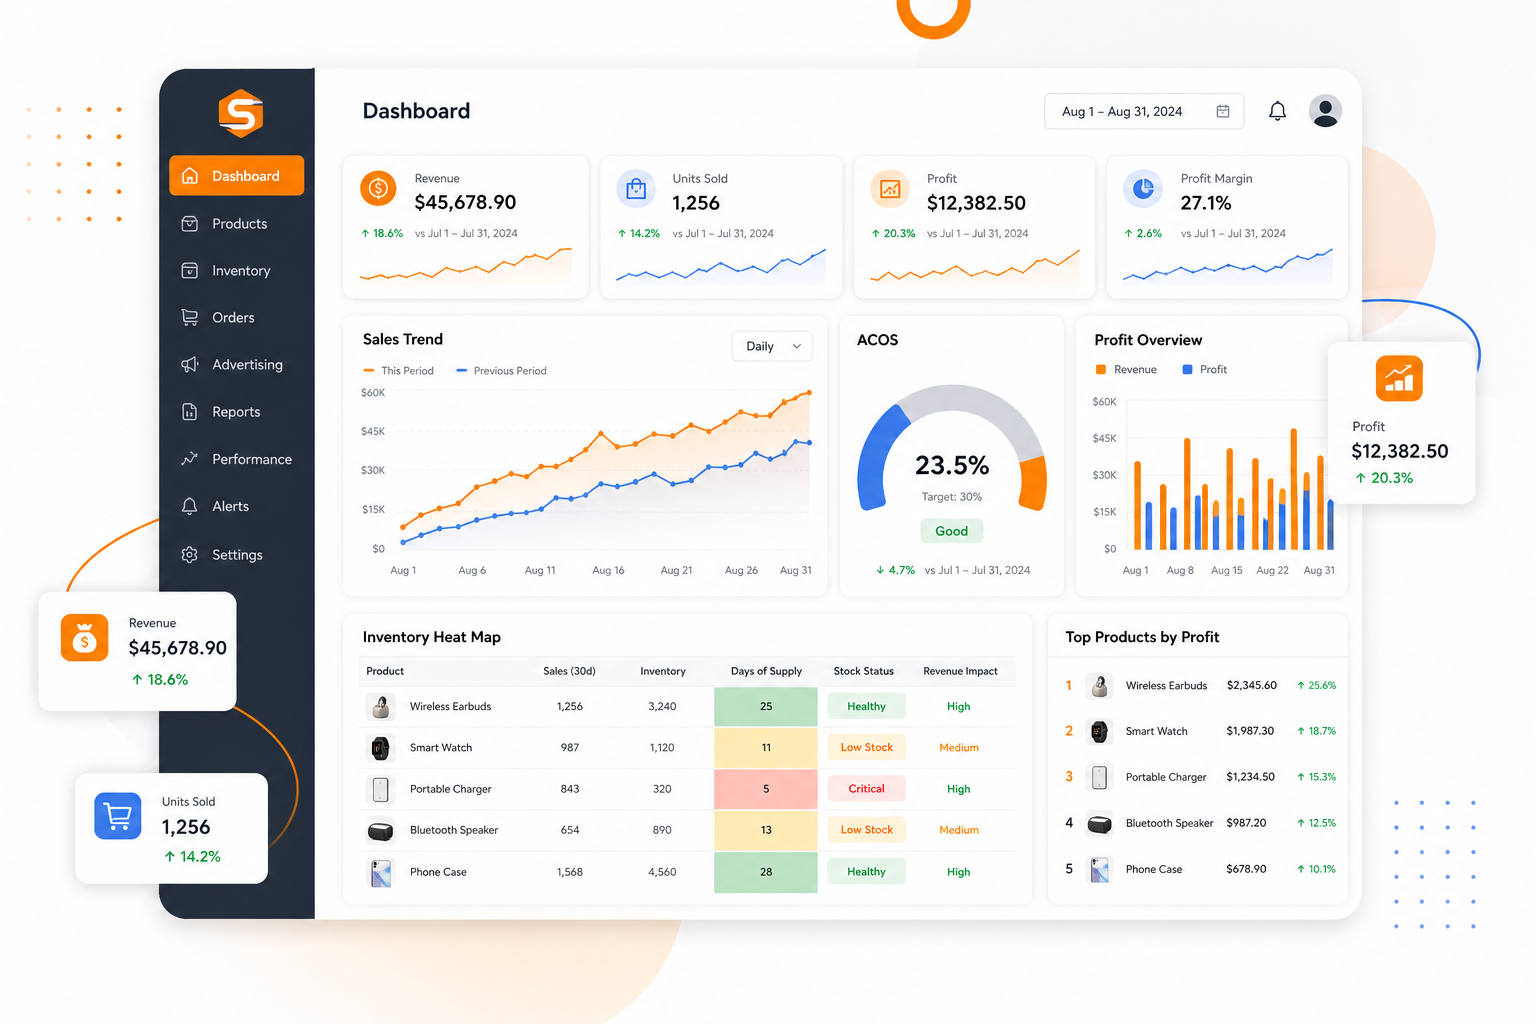
An Amazon business dashboard is a visual interface that consolidates your most important e-commerce metrics into one screen. Instead of logging into Seller Central, opening multiple reports, and copying numbers into Excel, a dashboard pulls data from across channels—sales, PPC, inventory, profits—and presents it as intuitive charts, tables, and scorecards. Think of it as the mission control for your Amazon operation.
Why invest in one? First, it saves time. A well-built dashboard updates automatically, so you don't spend hours compiling reports. Second, it improves accuracy by eliminating manual data entry errors. Third, it accelerates decision-making: you can instantly compare sales across periods, spot a failing ad campaign, or notice an inventory shortage. Finally, it makes collaboration easier—share a dashboard with your team or investors instead of sending dense spreadsheets.
Whether you're a first-time seller or managing a brand portfolio, a dashboard helps you answer critical questions at a glance: Are my sales growing? Is my ad spend efficient? Am I about to run out of stock? With the right setup, these answers become visual and obvious instead of buried in rows of data.
Key Metrics to Track on Your Amazon Dashboard
The sheer volume of data available from Amazon can be overwhelming. The trick is to choose metrics that directly reflect your business objectives. Here are the categories and the most important metrics to include in your dashboard:
Sales & Revenue: Track total revenue, units sold, average order value (AOV), and sales trend by day, week, or month. These metrics show your overall performance and growth trajectory.
Profit: Net profit is the ultimate measure of success. Monitor gross profit (revenue minus the cost of goods) and net profit (after all fees, shipping, and ad spend). Profit margin helps you understand the health of each product.
Advertising: For PPC campaigns, key metrics include ACOS (advertising cost of sale), TACOS, impressions, clicks, CTR (click-through rate), and CPC. These help you optimize your ad strategy and allocate budgets effectively.
Inventory: Keep a close eye on stock levels, sell-through rate, days of supply, and restock alerts. Inventory mishaps can lead to lost sales or storage fees, making this category critical.
Reviews & Customer Satisfaction: Average star rating, review count, and refund rate give you a pulse on product quality and customer happiness. Use sentiment analysis tools to categorize feedback.
Traffic & Conversion: Sessions, unique visitors, conversion rate, and session-to-order ratio show how effectively your listings convert traffic into sales.
Choose a core set of 5–10 metrics that align with your primary goals. For example, if you're scaling aggressively, focus on revenue and inventory; if profitability is your concern, track profit margin and ACOS. Avoid clutter—a dashboard that shows everything ends up communicating nothing.
Choosing Data Visualization Tools for Amazon
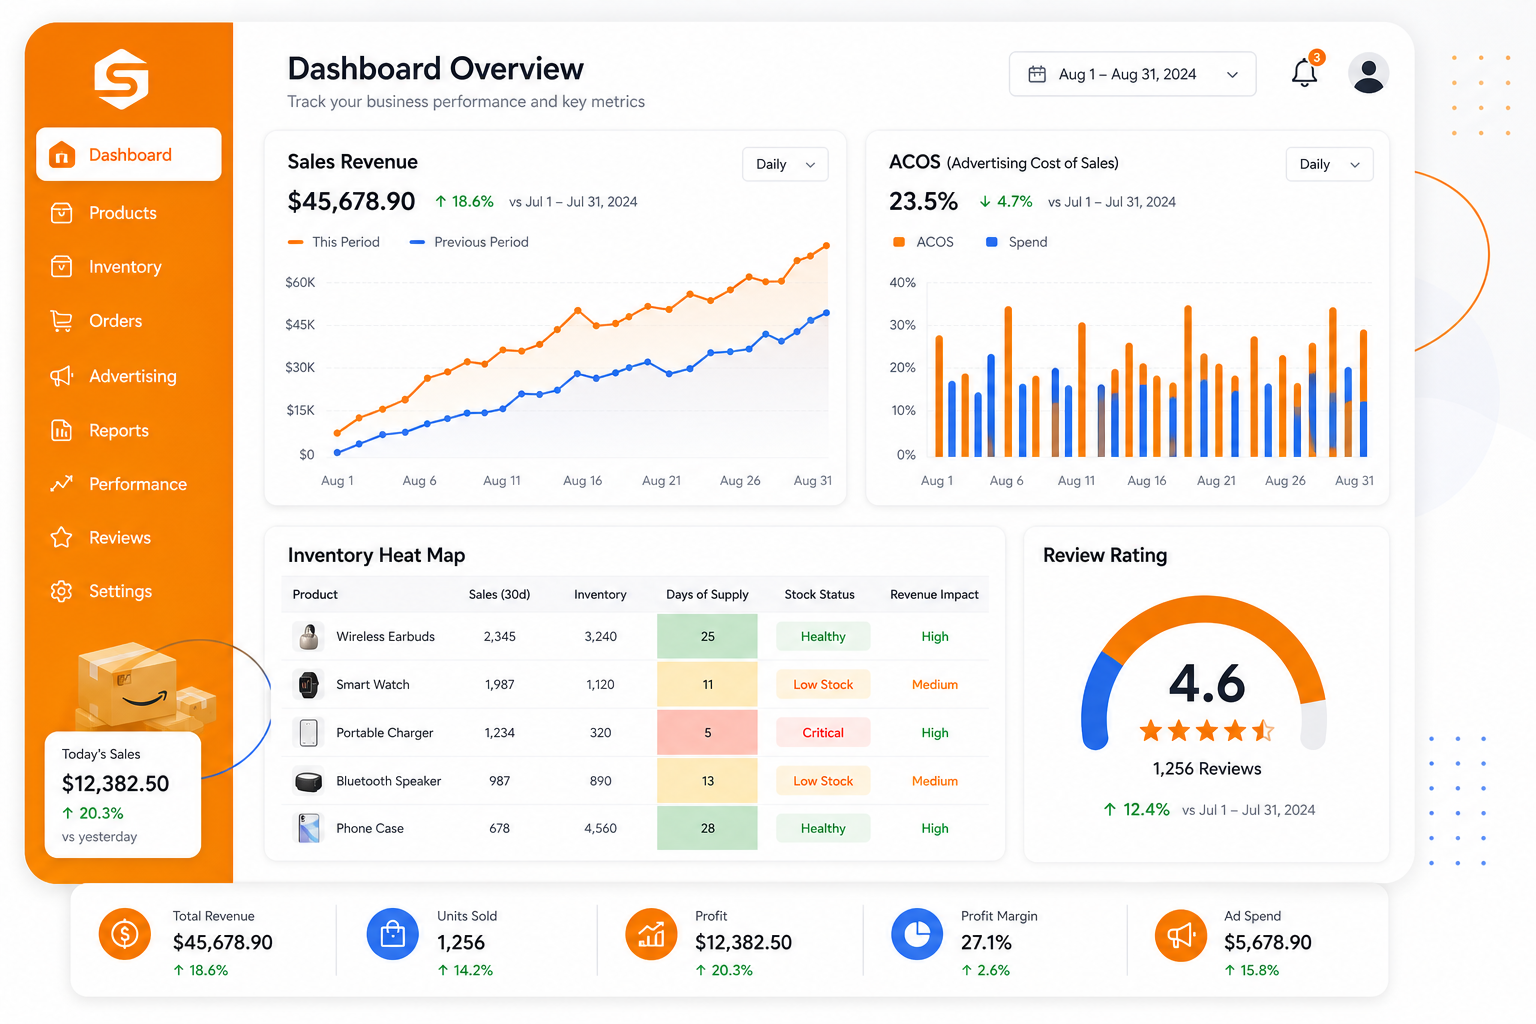
You don't need to build a dashboard from scratch. A range of tools—from out-of-the-box solutions to advanced BI platforms—can connect to your Amazon data and create visuals automatically. Here are the main types and examples:
All-in-One Amazon Seller Tools: Tools like SellerSprite offer built-in analytics dashboards, key performance indicators, and pre-built reports. They are designed specifically for marketplace sellers, so setup is quick and they often include the most relevant metrics out of the box.
BI Platforms: Tableau, Microsoft Power BI, and Google Data Studio allow heavy customization and can pull data from multiple sources via connectors. They're powerful but require more configuration. Google Data Studio, for instance, can integrate with Google Sheets and SQL databases to build a free dashboard.
Spreadsheet-Based Solutions: Excel or Google Sheets with add-ons like Supermetrics can gather data from Seller Central and map it into pivot charts. This is an excellent low-cost option if you're comfortable with spreadsheets.
When choosing a tool, consider: ease of connection to Amazon, update frequency, available templates, customization options, cost, and collaboration features. If you want a solution that gets you up and running in minutes, SellerSprite is a solid choice—it’s designed with the Amazon seller in mind. For a deeper dive on leveraging analytics across your Amazon operation, refer to our Amazon Seller Analytics Guide.
Step-by-Step Guide to Creating Your Dashboard
Now let's get hands-on. Follow these six steps to create an effective Amazon business dashboard, regardless of your technical skill.
Step 1: Define Your Goals and KPIs. Start with the decisions you want to make. For example, if your goal is to reduce ad spend, ACOS is a key metric. Write down 5–10 KPIs that will guide your strategy. Include targets (e.g., "ACOS under 25%").
Step 2: Collect and Connect Your Data. Identify all data sources: Seller Central, Amazon Ads, your inventory system, and financial software. If you're using a specialized tool like SellerSprite, connect your account and it will automatically sync the necessary data. Otherwise, export reports from Seller Central and set up a recurring transfer to your dashboard tool.
Step 3: Choose the Right Visualizations. Match each metric to an appropriate chart type: line charts for trends, bar charts for comparisons, gauges for progress toward targets, and tables for exact numbers. Avoid using a complex chart where a simple one will do.
Step 4: Design Your Dashboard Layout. Place your most critical metrics at the top. Use filters (like date range, marketplace, product tree) to allow users to slice the data. Group related metrics—sales, profit, ads—into separate panels. Keep the design clean, with consistent colors and labels.
Step 5: Set Up Automated Updates. Configure your tool to refresh data daily or weekly. If you're using SellerSprite, it updates automatically. For other platforms, schedule a data pull. Set up automated email reports for stakeholders who don't log into the dashboard.
Step 6: Review, Iterate, and Share. Share the dashboard with your team and gather feedback. Does it answer their questions? Are there metrics that cause confusion? Refine the design and choose new charts as your business evolves. Remember, a dashboard is a living tool, not a one-time project.
Best Practices for Effective Data Visualization
To get real value from your dashboard, keep these principles in mind:
1. Keep it simple. The best dashboards show only what's actionable. If a chart doesn't lead to a decision, remove it.
2. Use color strategically. Use contrasting colors to highlight outliers and align with standard meanings (green for good, red for concerning). But avoid a rainbow that distracts from the data.
3. Include benchmarks. Compare your current period to previous periods (weekly, monthly, yearly) and to targets. This context makes numbers meaningful.
4. Make it mobile-friendly. You'll likely check your dashboard on your phone. Ensure your charts are responsive and the layout is readable on smaller screens.
5. Add annotations. Mark important events like Prime Day, promotions, or stock issues so you can correlate spikes or dips.
6. Update intent. If real-time data isn't possible, clearly state the data freshness. Outdated information can lead to costly mistakes.
Following these practices ensures your dashboard remains a reliable tool for at-a-glance decision-making.
Advanced Dashboard Strategies for Decision Support
Once you've mastered the basics, you can turn your dashboard into a decision-support engine. Here are some advanced techniques:
Forecasting and Trend Analysis: Use historical data to project future sales, inventory needs, and cash flow. Simple regression or moving averages can be built into your dashboard. This helps you plan stock purchases and budget for advertising.
Alerts and Anomaly Detection: Set up automated alerts for key thresholds—e.g., when stock falls below a certain level, ACOS spikes above 40%, or sales dip unexpectedly. Many BI tools allow triggers and notifications.
Predictive and Prescriptive Analytics: Machine learning tools can analyze patterns and recommend actions, such as adjusting prices to maximize buy box wins or optimizing ad budgets. While complex, dashboard providers are increasingly integrating AI-driven insights.
Multi-Channel Consolidation: If you sell on other marketplaces or your own site, integrate all data into one dashboard for a unified business view. This is crucial for scaling.
Scenario Planning: Use what-if analysis to model changes (e.g., "What if I increase price by 10%?") and visualize the impact on profit.
As AI becomes more embedded in e-commerce, having a dashboard that feeds clean, consistent data to AI tools is a competitive advantage. To ensure your Amazon listings are ready for AI-driven automation, check out our Amazon Agent-Ready Attributes Audit 2026.
Data visualization is not just about pretty charts—it's about turning information into insight and action. By building a clear, focused dashboard for your Amazon business, you position yourself to react quickly to market changes, optimize profitability, and scale confidently. You now have the knowledge to choose the right metrics, tools, and processes. Take the first step and create a dashboard that gives you the clarity you need to thrive in the competitive US Amazon marketplace.
FAQ
How do I create a dashboard for my Amazon business?
Start by defining your main KPIs and choosing a tool that integrates with Amazon data (like SellerSprite, Google Data Studio, or Tableau). Connect your seller account, build your visualizations, and automate data refreshes. The step-by-step guide in this article walks through the process.
What are the top metrics to track on an Amazon business dashboard?
Focus on sales (revenue, units, AOV), profit (net profit and margin), advertising (ACOS, CTR, impressions), inventory (stock levels, sell-through rate), reviews (rating and count), and conversion (sessions, conversion rate). Pick 5–10 that match your goals.
Which data visualization tools integrate with Amazon seller data?
Popular options include SellerSprite (built for Amazon), Google Data Studio (with connectors), Tableau, Power BI, and Excel with Supermetrics. Choose one based on your budget, tech skills, and customization needs.
Do I need coding skills to build an Amazon dashboard?
No. All-in-one tools like SellerSprite offer pre-built templates and point-and-click interfaces. Even BI platforms like Tableau and Google Data Studio have intuitive drag-and-drop builders. Basic spreadsheet knowledge is enough for Excel-based approaches.
How often should I update my Amazon dashboard?
For operational metrics like sales and ads, daily updates are recommended. For inventory and finance, weekly updates are often sufficient. Many tools allow you to schedule automatic refreshes, so you don't have to worry about it.
Can I share my Amazon dashboard with team members?
Yes. Most dashboard tools support sharing via links, scheduled email reports, or team workspaces. This encourages collaboration and keeps everyone aligned.
Next Steps
- Pick your top three business goals for the next quarter.
- Identify the KPIs that will tell you if you're on track.
- Sign up for a free SellerSprite account and let its analytics dashboard do the heavy lifting.
- Set a weekly review session to act on the insights from your dashboard.
References
- Amazon Seller Central - Reports and Analytics: View
- Google Data Studio: View
- Tableau: View
- SellerSprite: View
By SellerSprite Content Expert
Amazon seller tools and marketplace SEO specialist.
Editorial process: AI-assisted draft prepared for human fact-checking, source verification, and brand review before publication.