TL;DR: Price elasticity measures how demand changes when you adjust pricing—master it to boost Amazon profits. This guide shows you exactly how to calculate elasticity, run effective A/B tests, and use data to find the sweet spot that maximizes revenue.
Key Takeaways
- Price elasticity quantifies how sensitive your customers are to price changes, directly impacting sales volume and revenue.
- Historical sales data is your most reliable source for calculating elasticity; learn the simple formula and step-by-step process.
- A/B split testing on Amazon (using variations or time-based experiments) gives you real-world elasticity insights without guesswork.
Table of Contents
- What Is Price Elasticity and Why It Matters on Amazon
- How to Calculate Price Elasticity from Your Historical Sales Data
- Step-by-Step: A/B Testing for Price Elasticity on Amazon
- Price Sensitivity Analysis: Segmenting Customers for Smarter Pricing
- Revenue Optimization Strategies Using Price Elasticity Data
- Tools and Analytics for Data-Driven Pricing
- Common Pitfalls When Testing Pricing Strategies
- Conclusion: Building a Data-Driven Pricing Culture
- FAQ
- References
Note on marketplaces: This guide is specifically optimized for the US market.
What Is Price Elasticity and Why It Matters on Amazon
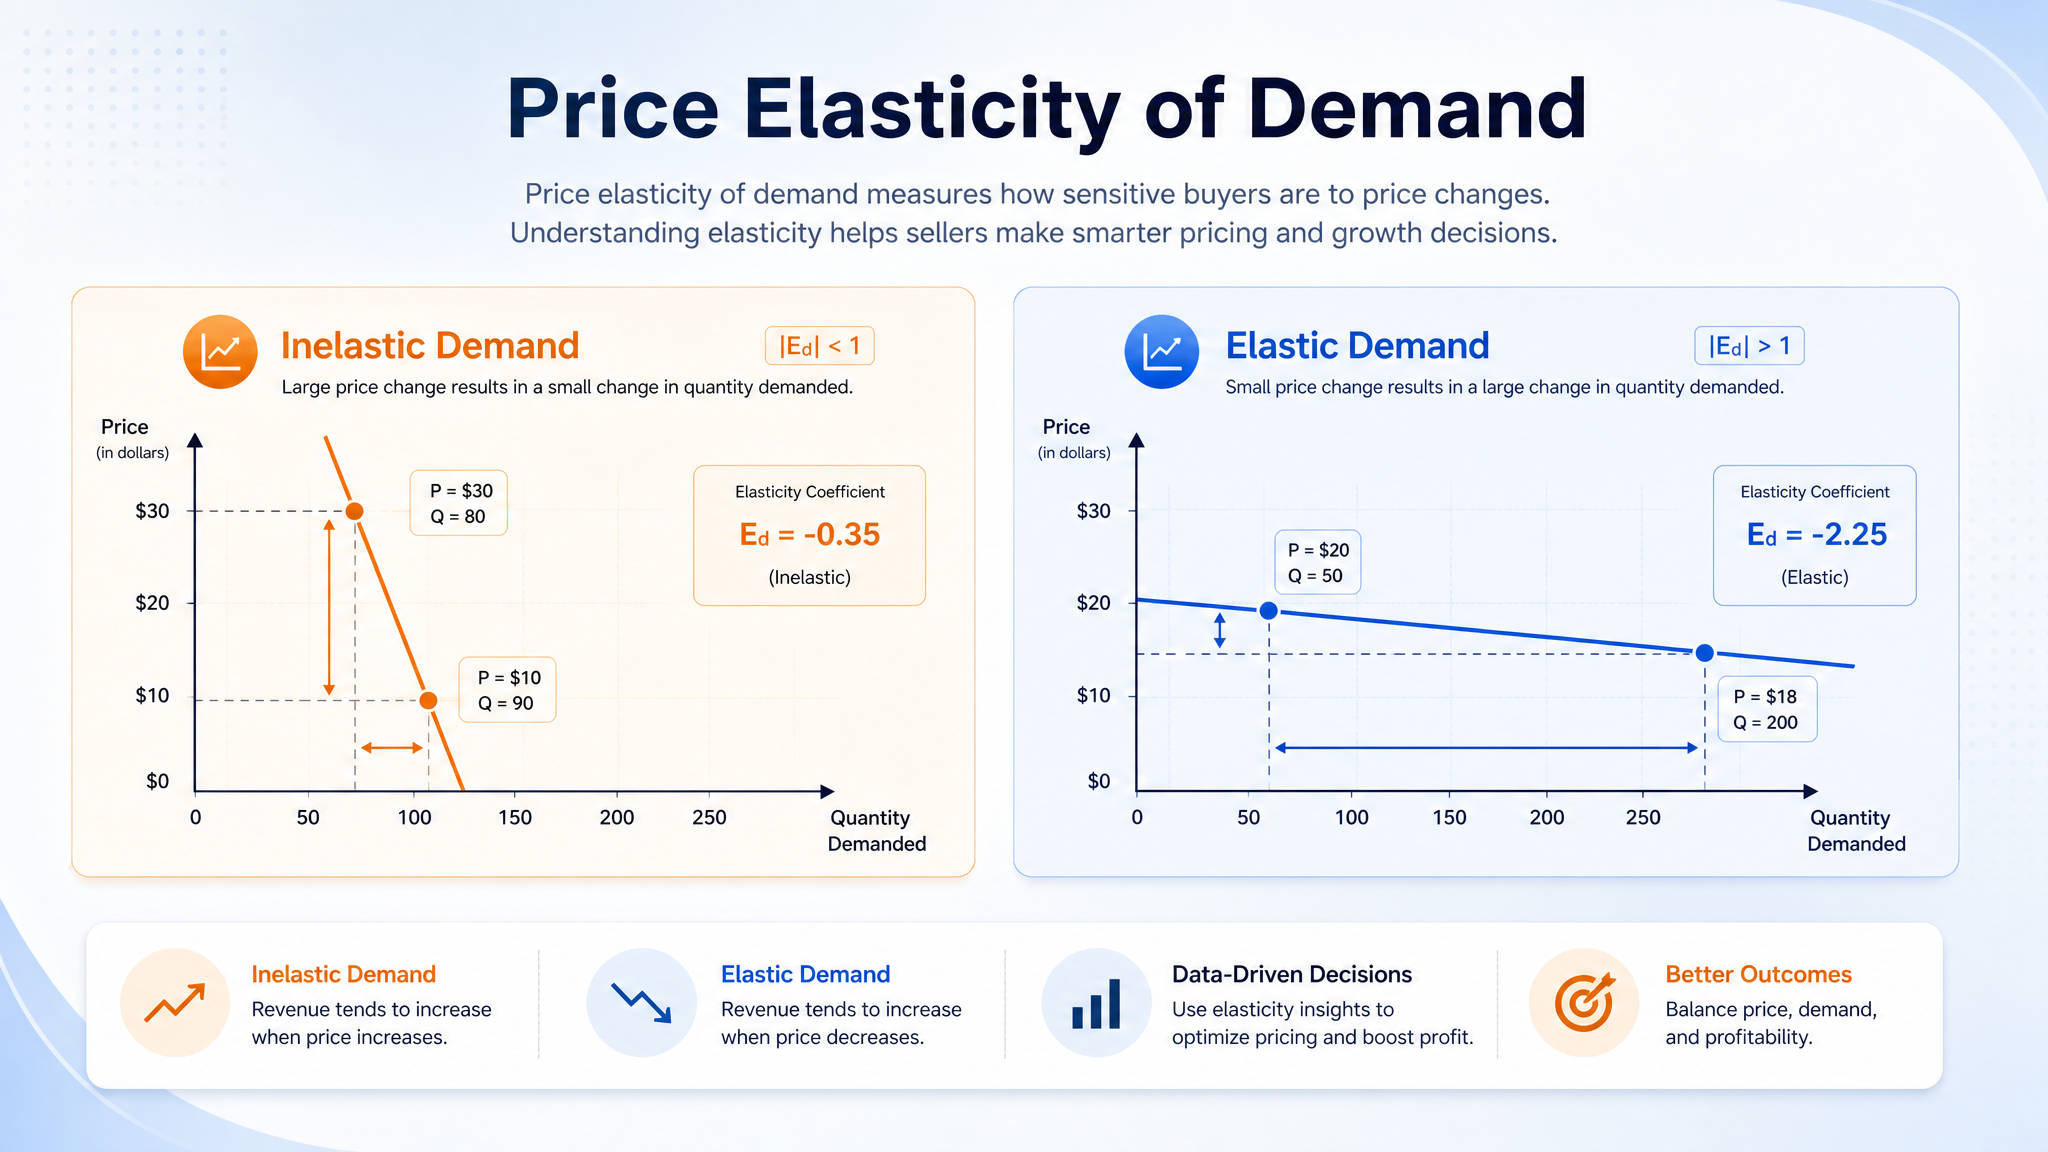
Price elasticity of demand (PED) measures how the quantity demanded of a product changes in response to a price change. In simple terms: if you lower your price by 10%, will sales jump by 20% or only 2%? For Amazon sellers, understanding this relationship is the difference between leaving money on the table and capturing maximum profit. In a marketplace with fierce competition and price-sensitive shoppers, guessing is dangerous—data is your compass.
Products fall into two broad categories: elastic and inelastic. Elastic goods (luxury items, non-essentials) see dramatic swings in demand when prices change. Inelastic goods (necessities, unique patented items) have more stable demand regardless of price. Most Amazon products sit somewhere in between, and that’s where your analysis becomes critical. By quantifying elasticity, you can predict the outcome of a price change before you make it, aligning pricing with your business goals—whether that’s driving volume, increasing margins, or toppling a competitor.
Consider a real-world scenario: a seller of reusable water bottles notices that a 15% price cut during Prime Day increased daily units sold by 40%. That’s a highly elastic response. Outside of deal events, perhaps a 5% price drop only lifted sales by 3%—much more inelastic. Without a structured approach to measuring these shifts, you can’t set optimal everyday prices or plan profitable promotions. This guide will walk you through the precise methods to turn raw sales data into actionable pricing intelligence.
How to Calculate Price Elasticity from Your Historical Sales Data
Before running active tests, your own Amazon sales history is a goldmine for calculating price elasticity. The core formula is straightforward: Price Elasticity of Demand = (% Change in Quantity Demanded) / (% Change in Price). You need at least two comparable periods where price differed while other conditions (seasonality, competition, stock availability) were relatively stable. Here’s how to compute it reliably:
Gather Clean Data
Export your Amazon sales reports (from Seller Central or a tool like SellerSprite’s analytics dashboard) for a product over a 30- to 90-day window. Filter out days with stockouts, lightning deals, or major ranking fluctuations that aren’t price-related. You want the price–unit relationship as clean as possible. For example, if you sold a kitchen gadget at $19.99 for two weeks and then at $17.99 for the next two weeks (with no other changes), you have a perfect mini-test.
Calculate the Changes
Suppose at $19.99 you averaged 20 units per day; at $17.99 you averaged 28 units. The price change is a decrease of $2.00, or –10.0%. The quantity change is an increase of 8 units, or +40%. Plug into formula: 40% / –10% = –4.0 (the sign is usually ignored; we care about magnitude). An elasticity of 4.0 means demand is highly elastic—a 1% price drop yields a 4% sales bump.
Interpret the Coefficient
- >1 (Elastic): Demand is sensitive to price. Cutting price can increase total revenue; raising price may hurt it.
- =1 (Unit Elastic): Revenue stays the same with price changes—volume offsets the price change exactly.
- <1 (Inelastic): Demand is sticky. You can raise prices with minimal volume loss, often increasing revenue.
Historical analysis is prone to noise, so always run this on several periods and average the results. Pair it with competitive benchmarking: if competitors are priced higher and still selling, your product may be more inelastic than you think. For more on how price feeds into discoverability, check out our article on how price changes affect keyword ranking. The interplay between price and organic visibility can amplify elasticity effects.
Step-by-Step: A/B Testing for Price Elasticity on Amazon
Historical data gives you a baseline, but controlled experiments yield cleaner insights. On Amazon, true A/B price testing isn’t built-in (you can’t show different prices to random visitors for the same ASIN), but you can simulate it safely. Here’s a proven workflow:
1. Select a Test Product with Stable Traffic
Choose an item with consistent daily sales (at least 10–15 orders/day) to ensure statistical significance. Avoid seasonal or trend-driven products. The longer the test, the more reliable the results—aim for a minimum of two weeks per price point.
2. Set Your Price Points Strategically
Test three levels: your current price (control), a lower price (say, –8%), and a higher price (+8%). Small changes, like 5–10%, minimize the risk of triggering Amazon’s price gouging flags or alienating customers. Record the start and end dates, and ensure no other promotions run simultaneously.
3. Run the Phases Sequentially
Week 1–2: Keep price at current level (gather baseline). Week 3–4: Lower to test point A. Week 5–6: Raise to test point B. By comparing average daily units and revenue across phases, you can compute elasticity for each shift. Use a simple spreadsheet to track the KPIs.
c
4. Account for External Variables
Monitor competitor price changes, ad spend fluctuations, and marketplace traffic shifts. If a major competitor runs a sale during your higher-price phase, your data will be contaminated. A pricing analytics tool can alert you to these swings—learn about top solutions in our roundup of top Amazon seller tools for price tracking.
5. Analyze and Decide
Compute elasticity for each price change and project the revenue impact at scale. If a small price increase leads to minimal unit loss, you’ve discovered inelastic demand and can grow profits. If a price drop causes a disproportionate sales surge, you might dominate a subcategory through volume. Always weigh the impact on your Amazon Best Sellers Rank (BSR) and organic keyword rankings—sometimes a short-term revenue dip is worth long-term visibility gain.
For sellers managing multiple ASINs, automated split testing platforms (like SellerSprite’s upcoming experiment module) can schedule and track these phases, ensuring you never miss a data point.
Price Sensitivity Analysis: Segmenting Customers for Smarter Pricing
Not all buyers are equally price-sensitive. A blanket elasticity figure hides nuance—some segments will pay a premium, while others only convert when you’re the cheapest option. Conducting a sensitivity analysis lets you tailor pricing for maximum overall revenue. Here’s how to uncover these layers:
Identify Behavioral Clusters
Use your Amazon Brand Analytics (ABA) demographics and repeat purchase behavior to segment customers. For instance, first-time buyers of a supplement might be more price-sensitive than subscribers who value convenience. In a durable good, impulse buyers (often via mobile) are less price-sensitive than desktop shoppers who compare multiple listings. Tag orders by traits like purchase frequency, time of day, and device.
Run Conditional Elasticity Calculations
Filter your historical data by segment. For example, calculate elasticity on orders placed between 9 PM and midnight (mobile-heavy, possibly less price-sensitive) versus 9 AM–5 PM hours. One brand found that their elasticity was 0.8 for evening shoppers but 2.2 during business hours—because daytime buyers were deal-hunting office workers. This insight allowed them to adjust dynamic pricing rules via automated repricer software.
Leverage Geographic and Competitive Sensitivity
Price sensitivity often varies by region. In the US market, buyers in high-cost-of-living areas may tolerate higher prices for convenience goods. Pair Amazon’s sales heat maps with competitor density data: if only one other seller competes in a particular niche, your price elasticity might be far lower than in a crowded national market.
By mapping sensitivity across cohorts, you can design targeted promotions—use a coupon code for the price-sensitive cohort while keeping the standard price for inelastic segments. This requires a deep understanding of your Amazon seller analytics setup, but the payoff in margin improvement can be substantial.
Revenue Optimization Strategies Using Price Elasticity Data
Knowing your product’s elasticity is only the start; the real value lies in applying it to maximize profit. Here are battle-tested strategies that translate coefficients into cash:
Dynamic Pricing Bands
Set automated rules that adjust your price within a predefined band based on elasticity zones. For an elastic product (PED > 1.5), let the repricer compete aggressively during low-traffic hours to capture volume, then pull back to a moderate price during peak shopping windows when demand is less reactive. Tools like SellerSprite’s price optimization module can manage this with minimal oversight.
Bundle Pricing for Inelastic Demand
If your core product is inelastic, create bundles that increase the perceived value without significantly altering the unit price. For example, a phone case with inelastic demand can be bundled with a screen protector; the bundle price can be set higher than the sum of individual items because customers are less price-sensitive when buying a complete solution. Analyze bundle elasticity separately—you may find that bundles can sustain a higher overall price point.
Tiered Promotions Based on Elasticity
Run percent-off coupons calibrated to elasticity. Highly elastic ASINs respond well to even a 5% coupon; inelastic ones might need a 15% off to move the needle, and that might not be worth it. Use data to set the minimum discount that produces a measurable lift, preserving margin.
Price Anchoring with Parent-Child Variations
If you offer multiple variations (sizes, colors) under one parent ASIN, use price anchoring. List a premium variation at a high price that few will buy, but serves as a reference point. The main variation appears more attractive, and its elasticity may shift because of the anchor. Test this by introducing a “luxury” SKU and measuring the resulting elasticity of the mid-tier option.
Revenue optimization also means knowing when to stay put. Avoid price wars if your product is inelastic—let competitors slash prices while you maintain margin. Monitor your BSR and organic rank; sometimes letting a competitor take a few sales is cheaper than eroding your own profitability. For more on managing price swings and glitches that can disrupt experiments, read our piece on Amazon price glitches and how to handle them.
Tools and Analytics for Data-Driven Pricing
Manually crunching numbers in Excel is a start, but scaling your pricing intelligence requires specialized software. Here are the key categories and what to look for:
- Amazon Analytics Suites: Platforms like SellerSprite integrate sales, traffic, and competitive data, letting you view price vs. unit trends over custom date ranges. They also offer repricing automation tied to your elasticity rules.
- Price Experimentation Tools: Some third-party services offer virtual A/B testing by analyzing organic data patterns, though they don’t physically split test on Amazon. They use machine learning to infer elasticity from your historical sales and competitor movements.
- Market Intelligence: Tools that track competitor pricing, stock levels, and BSR changes help you isolate external factors during your tests, ensuring cleaner elasticity calculations.
- Financial Modeling: For advanced users, connecting Amazon data to a profit & loss dashboard allows you to simulate the bottom-line effect of different pricing strategies before implementation.
When choosing a tool, ensure it supports the US marketplace natively and handles FBA fee calculations accurately. A good starting point is our curated list of the best Amazon seller tools for 2026, which covers everything from product research to pricing analytics.
Common Pitfalls When Testing Pricing Strategies
Even seasoned sellers stumble. Avoid these traps to keep your data clean and decisions sound:
- Ignoring Seasonality: A price test during Q4 holiday rush or Prime Day will produce skewed elasticity. Always compare like-for-like periods or use year-over-year data.
- Small Sample Size: For low-volume ASINs, a week or two of data isn’t enough. A few extra orders due to chance can throw off the calculation. Aim for at least 30–50 transactions per price point.
- Confusing Correlation with Causation: A competitor temporarily going out of stock can inflate your sales, making your product look more elastic than reality. Track external events religiously.
- One-and-Done Testing: Elasticity changes over time as new competitors enter or your product matures. Re-test quarterly or whenever you launch a variant.
- Focusing Only on Units, Not Revenue: A 50% increase in unit sales sounds great, but if it requires a 40% price cut, net revenue might barely grow. Always model the total revenue impact.
Also, be mindful of Amazon’s fair pricing policy. Aggressive price swings may trigger suppression of the Buy Box. Stay within reasonable bounds, especially if you’re testing upward movements—Amazon expects your price to be “competitive” relative to historical and external prices.
Conclusion: Building a Data-Driven Pricing Culture
Price elasticity isn’t a one-time project; it’s a continuous feedback loop that drives smarter decisions across your catalog. By combining historical analysis, controlled A/B experiments, and customer segmentation, you can move from reactive price changes to proactive strategy. Start with one hero ASIN, compute its baseline elasticity, and test a small price adjustment. Use the insights to fine-tune and expand.
The US market is dynamic, but sellers who embed data-driven pricing into their operations gain a durable advantage. Remember, the lowest price doesn’t always win—the smartest price does. Equip yourself with the right tools, keep an eye on your seller analytics, and turn elasticity into your secret weapon for sustainable growth.
FAQ
How do I measure price elasticity using historical sales data in the US?
To measure price elasticity from historical data, first export your Amazon order reports for a specific ASIN over a period with at least two distinct price points (e.g., $15 and $13). Calculate the percentage change in average daily units sold and the percentage change in price. Divide the quantity change by the price change. For US sellers, ensure you account for any promotions, seasonality, and competitive shifts during the period. Tools like SellerSprite can automate this calculation across multiple time windows to give you a reliable average elasticity coefficient.
What are the best A/B testing methods for price elasticity?
The best method for most sellers is a sequential time-based test: run the product at its current price for two weeks, then at a slightly lower price (e.g., –7%) for two weeks, then at a slightly higher price (+7%) for two weeks. Compare average daily units and revenue across phases. For more advanced needs, use price experimentation software that tracks isolated test variations, but always ensure external variables (ads, inventory, competition) are controlled. A/B testing with multiple ASINs in the same niche can also reveal category-level elasticity.
Which tools analyze price elasticity for e-commerce in the US?
Several tools cater to Amazon sellers in the US: SellerSprite offers integrated sales analytics and pricing insights; other platforms like Jungle Scout and Helium 10 allow tracking of price and BSR over time, which you can use to estimate elasticity manually. For automated elasticity analysis, services like PriceLabs and repricing engines with built-in elasticity calculators are available. Always verify the tool supports US marketplace fee structures and provides accurate sales estimates.
Next Steps
- Start your price elasticity analysis with a free SellerSprite account — sign up here and connect your Amazon data to see real-time sales trends.
- Pick one high-volume ASIN and run the sequential A/B test described above. Track results in a simple spreadsheet or using SellerSprite’s dashboard.
References
- How Price Changes Affect Keyword Ranking on Amazon View
- Top 10 Amazon Seller Tools in 2026: From Product Research to Price Tracking View
- Amazon Price Glitches: What They Are and How to Protect Your Business View
- Amazon Seller Analytics Guide – SellerSprite View
By SellerSprite Success Team
Amazon seller tools and marketplace SEO specialist.
Editorial process: AI-assisted draft prepared for human fact-checking, source verification, and brand review before publication.